Entertaining data for brands
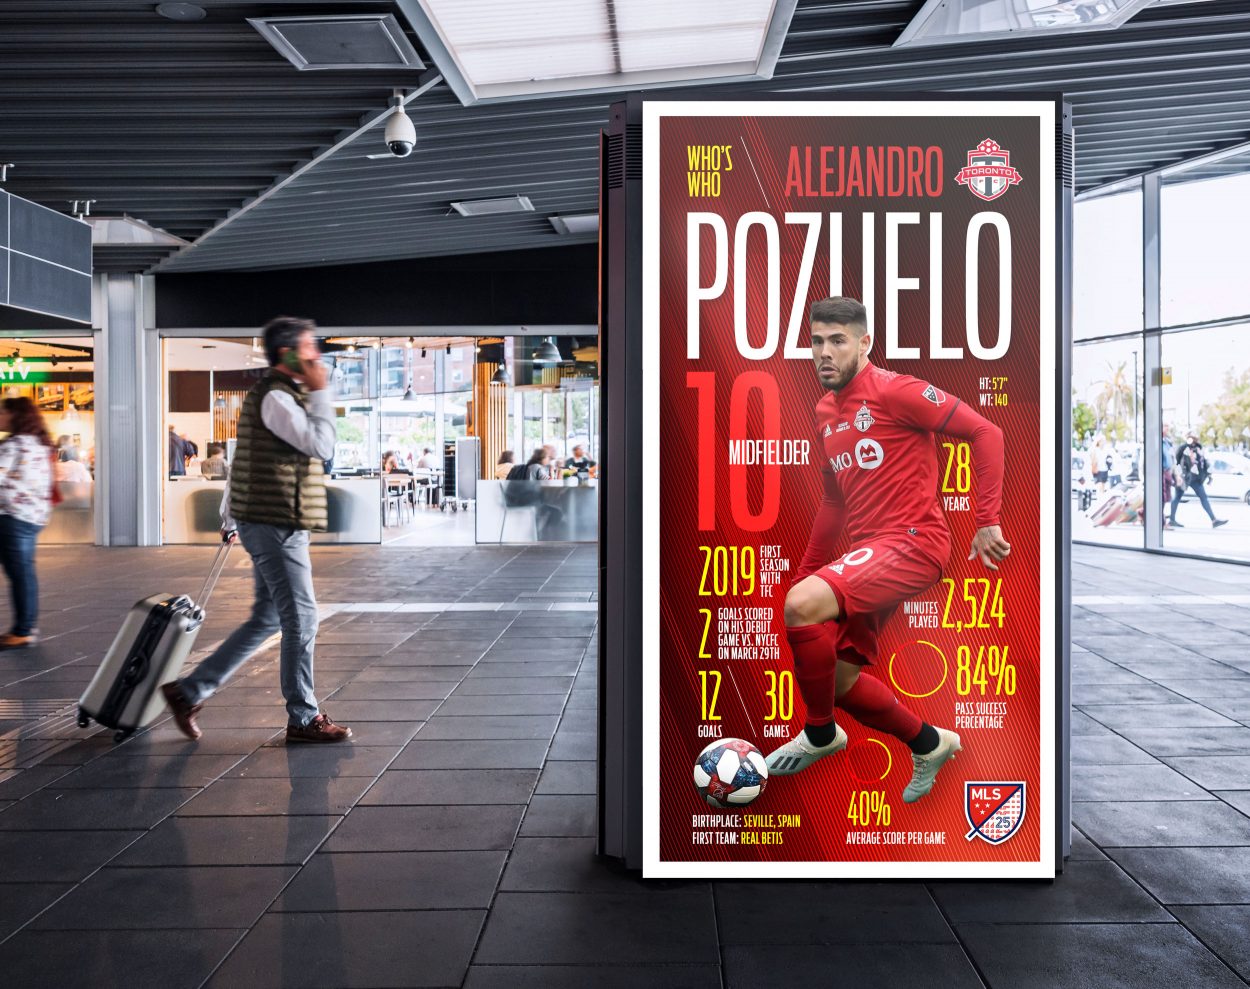
When we talk about graphics or data visualization we think as those graphics mostly used in newspapers or magazines. But we never think of the possibilities and the potential they have to simplify complex content that can be used on brands or campaigns (sports, technology, etc). The use of graphics can be applied to almost anything. They don’t have to be complex; simple data visualization can help drive data to our consumers and it can be attractive and entertaining.
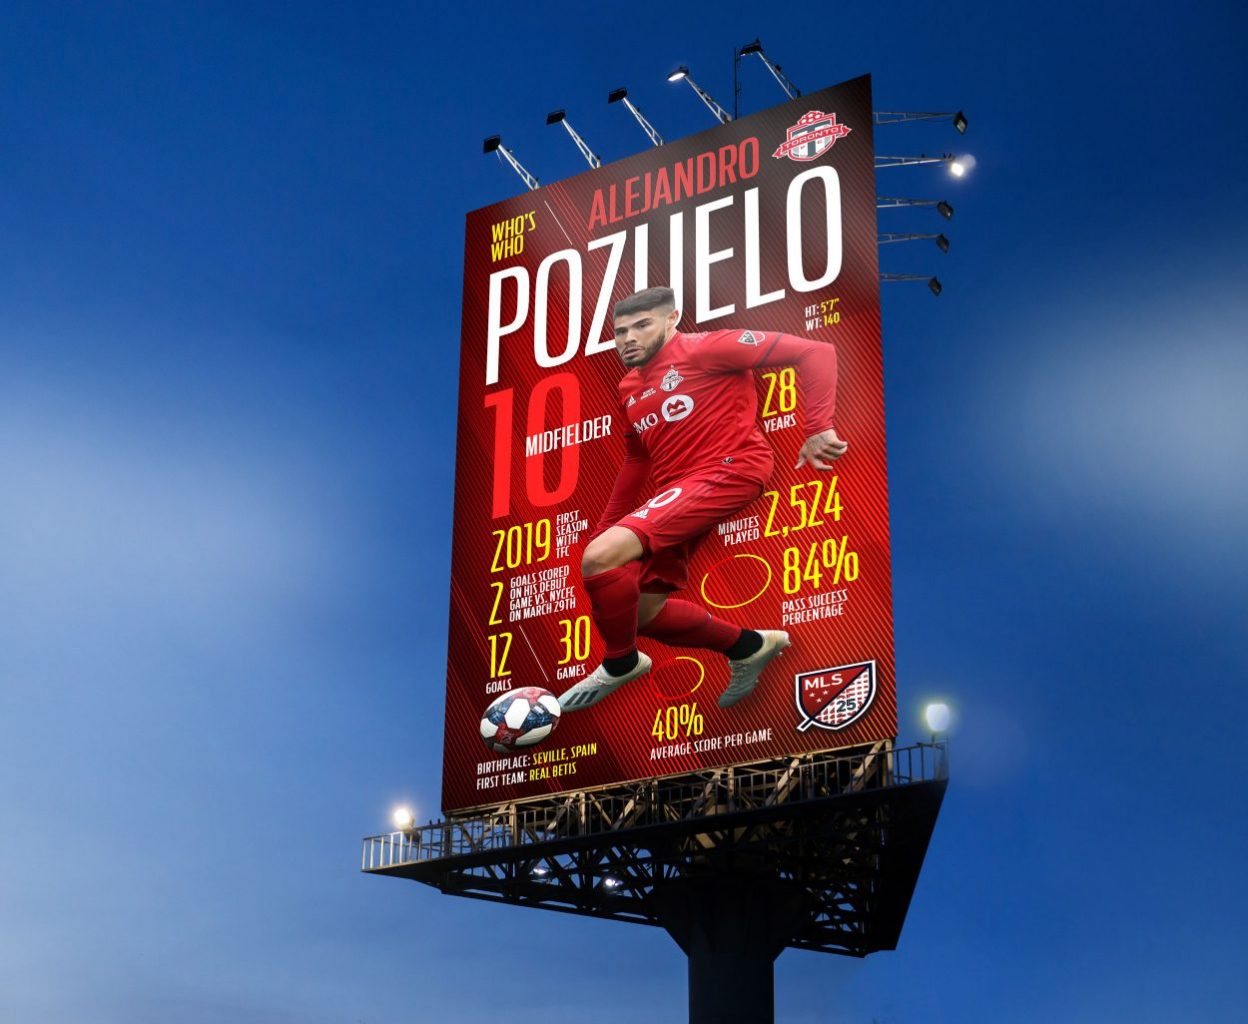
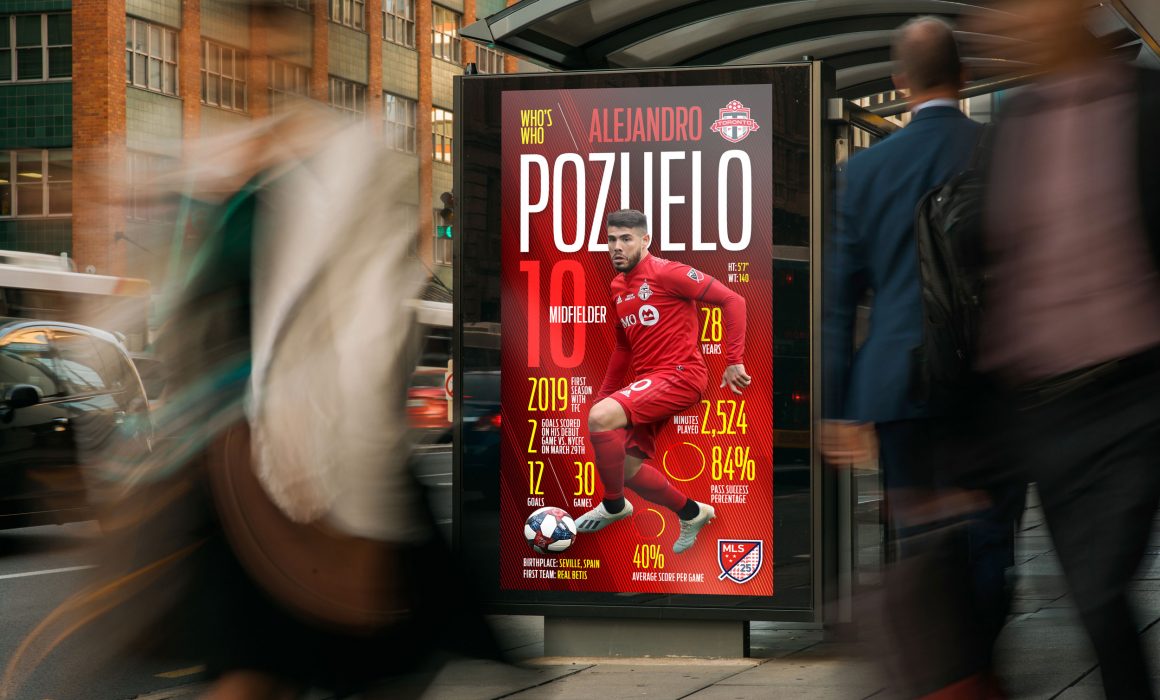
This is just a simple example of what can be done on billboards (as part of a bigger ad campaign). Imagine the start of the MLS season and you want to attract fans (and not so fans) to know your team and players. You can display them through the city (street billboards, subway, newspapers, print or digital, etc). And you can do some rotating ones during the season advertising their home games. Your fans will love it and you will be able to reach new ones empowering you brand.
Data visualization can be a powerful, graphic and strategic content tool for brands if its used wisely (meaning you have to see where and how will it be published, space, readability, print or digital, etc.).Have an idea? We are here to help. www.danielesqueda.com


